 |
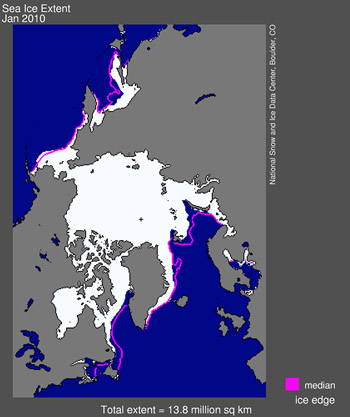
| Arctic sea ice extent for January 2010 was 13.78 million square kilometers (5.32 million square miles). The magenta line shows the 1979 to 2000 median extent for that month. The black cross indicates the geographic North Pole.(NSID) |
|
Despite cool temperatures over most of the Arctic Ocean in January,
Arctic sea ice extent continued to track below normal. By the end of
January, ice extent dropped below the extent observed in January 2007.
Ice extent was unusually low in the Atlantic sector of the Arctic, the
one major area of the Arctic where temperatures remained warmer than
normal.
Overview of conditions
Arctic
sea ice extent averaged for January 2010 was 13.78 million square
kilometers (5.32 million square miles). This was 1.08 million square
kilometers (417,000 square miles) below the 1979 to 2000 average for
January, but 180,000 square kilometers (69,000 square miles) above the
record low for the month, which occurred in January 2006.
Ice
extent remained below normal over much of the Atlantic sector of the
Arctic, including the Barents Sea, part of the East Greenland Sea, and
in Davis Strait. The only region with above-average ice extent was on
the Pacific side of the Bering Sea.
Conditions in context
During
January 2010, ice extent grew at an average of 34,000 square kilometers
(13,000 square miles) per day. Sea ice extent increased at a fairly
steady rate in the early part of the month and then slowed towards the
end of January. A brief slowdown in ice growth is not unusual during
winter.
Looking over the entire season,
this winter continues the recent trend of slower Arctic ice growth.
During the 1980s, the average rate of ice growth for January was
approximately 90,000 square kilometers (35,000 square miles) per day.
In comparison, during the 1990s, the average rate of January growth
fell to about 40,000 square kilometers (15,000 square miles) per day.
Including 2010, the average for the 2000s is 39,000 square kilometers
(15,000 square miles) per day.
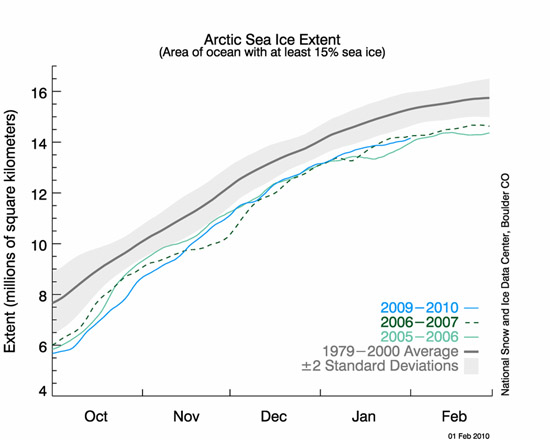 |
| The graph above shows daily sea ice extent as of February 1, 2010. The solid light blue line indicates 2009/2010; dashed green indicates 2006/2007; light green shows 2005/2006 (the record low for the month of January); and solid gray indicates average extent from 1979 to 2000. The gray area around the average line shows the two standard deviation range of the data. (NSID) |
|
January 2010 compared to past years
While
Arctic sea ice extent has declined in all seasons, the downward trends
in winter ice extent are much smaller than in summer. Polar darkness
and low temperatures mean that the ice generally refreezes to about the
same boundaries each winter. Ice extent averaged for January 2010 was
the fourth lowest for the month since the beginning of satellite
records, and 180,000 square kilometers (69,000 square miles) higher
than the record low January extent observed in 2006. The linear rate of
decline for January is now 3.2% per decade.
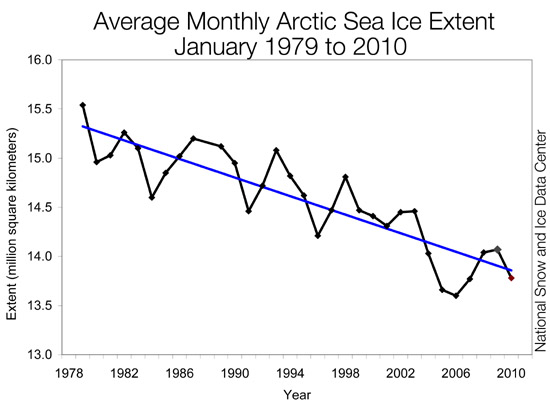 |
| Monthly January ice extent for 1979 to 2010 shows a decline of 3.2% per decade. (NSID) |
|
A shift in atmospheric circulation
As discussed in our January post,
December 2009 was characterized by an extreme negative phase of the
Arctic Oscillation, with the Arctic Ocean dominated by unusually high
surface pressure and air temperatures. In January, the Arctic
Oscillation shifted from strongly negative to neutral in the middle of
the month, and then back to a negative phase at the end of the month.
For more information on the Arctic Oscillation, see the NOAA Climate Prediction Center Web site.
In contrast to December, January saw unusually low pressure over the
central Arctic and unusually high pressure over western Europe and
Asia. While temperatures over much of the central Arctic Ocean were 1
to 3 degrees Celsius (2 to 5 degrees Fahrenheit) below normal,
temperatures in the Kara and Barents seas were 3 to 5 degrees Celsius
(5 to 9 degrees Fahrenheit) warmer than normal. Ice extent was far
below normal in the Kara and Barents seas, keeping the total Arctic sea
ice extent below average.
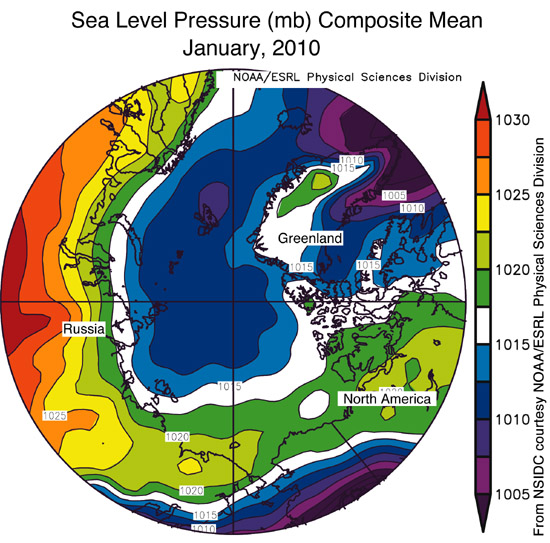 |
| The map of sea level pressure anomalies (in millibars) for January 2010 shows higher than average pressures over western Europe and Asia (areas in orange and red) and lower than average pressures over the central Arctic Ocean (areas in blue and purple. (NOAA) |
|
Slow freeze-up keeps ice extent low
Analysis
of data from the last three decades shows that the summer Arctic sea
ice melt season now lasts nearly a month longer than it did in the
1980s. A later start of freeze-up and an earlier start to the melt
season both contribute to the change. A recent paper by Thorsten Markus
at NASA Goddard Space Flight Center suggests that the later freeze-up
is the dominant factor lengthening the melt season. The analysis shows
that, on average, autumn freeze-up starts nearly four days later each
decade. Extensive open water at the end of the summer melt season,
combined with warmer autumns, delay the autumn freeze-up. The larger
expanses of open water absorb more solar energy, and before ice can
form again, that heat must be released back to the atmosphere. This
trend is most pronounced in the Beaufort, Chukchi and Laptev seas.
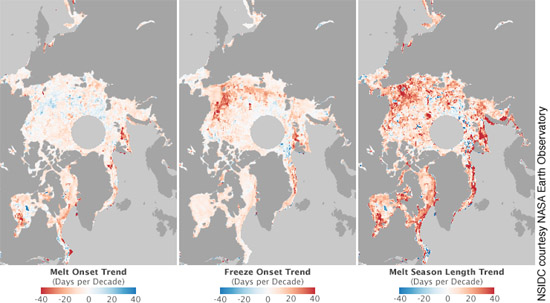 |
| This map of the Arctic shows how earlier melt onset (left) and later freeze onset (middle) have contributed to a longer melt season (right), over the past 30 years. (NASA) |
|
References
Markus, T., J. C. Stroeve, and J. Miller. 2009. Recent changes in Arctic sea ice melt onset, freezeup, and melt season length. Journal of Geophysical Research, 114, C12024, doi:10.1029/2009JC005436.
National Snow and Ice Data Center

 Print This
  Print This