|

|
The Best Way to Eradicate Poverty: Welfare, not jobs
 Print This Print This
By Matt Bruenig | Peoplespolicyproject.org
Popular Resistance
Wednesday, Oct 3, 2018
 |
| Photo: Jon Collier / Flickr |
The Census released its income, poverty, and health insurance data last week (ASEC, SPM). Among other things, the data allows us to see who was in poverty and therefore gives us good insights about how to eradicate poverty. In this post, I detail what I think these insights are using my own calculations of the 2017 microdata.
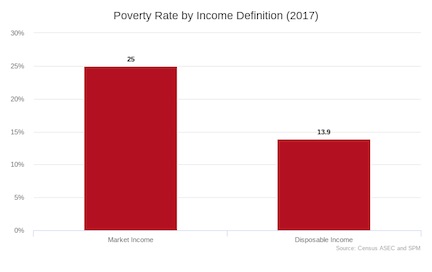
Below is the overall poverty rate broken down by market income and disposable income. “Market income” refers to all income received from labor earnings and capital ownership. “Disposable income” refers to each person’s final income and takes into consideration taxes paid and government benefits received. For both figures, I use the poverty line of the Supplemental Poverty Metric. In 2017, the market poverty rate was 25 percent. The poverty rate when counting disposable income was 13.9 percent.
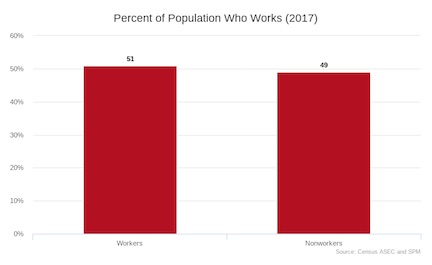
Nonworkers Make Up Half Of The Country
To really understand what poverty is about, it is important to first recognize that about half of Americans do not work, i.e. they do not do market labor. In 2017, 49 percent of Americans worked 0 hours of market labor.
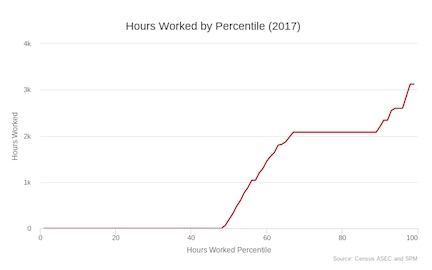
To further drive home the point about worklessness, here is a graph that shows how many hours were worked at every hours-worked percentile. What this means is that I have lined up the entire population from least hours worked to most hours worked and then found the precise number of hours worked at each percentile of the distribution. This graph shows (as in the above graph) that just under 49 percent of people worked 0 hours in 2017. Around one-third worked full time (2,080 hours) or higher.
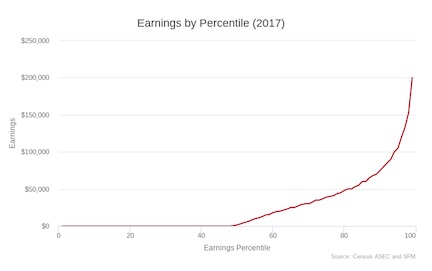
Naturally, if half of the people do not work, then half of the people have zero labor market earnings. Here is the distribution of individual labor market earnings across the entire population.
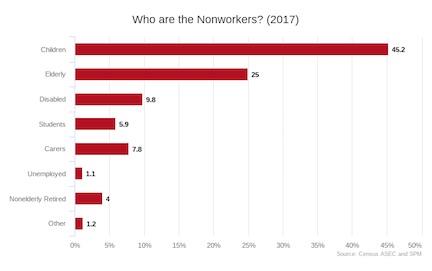
To figure out who the nonworkers are, I created 8 groups of people and then assigned each nonworker to 1 of the 8 groups. The groups are:
- Children. People aged 0 to 17.
- Elderly. People aged 65 and over.
- Disabled. People who have one of the serious disabilities tracked by the Census or people who said they were not employed for all or some of the year due to illness or disability.
- Students. People who said they were not employed for all or some of the year because they were students.
- Carers. People who said they were not employed for all or some of the year because they were taking care of family.
- Unemployed. People who were not employed for all or some of the year because they were looking for work or because they could not find a job.
- Nonelderly Retired. People who said they were not employed for all or some of the year because they were retired.
- Other. Everyone not falling into one of the categories above.
Individuals who fall into more than one category are assigned to the first category they qualify for in the order of the list above. Thus, a disabled person who is also a student will be counted under the disabled category not the student category.
Based on this method, the below graph shows who the nonworkers were in 2017. Children and elderly make up 70.2 percent of the nonworkers. The disabled and students make up a further 15.7 percent. Carers make up 7.8 percent.
What’s important to note about this is that the vast majority of nonworking people cannot or should not be working. Children, elderly, disabled, and students make up about 86 percent of nonworkers. Some of the remaining 14 percent could possibly be activated into the workforce, though it’s unclear exactly how many.
Poverty Afflicts Nonworkers
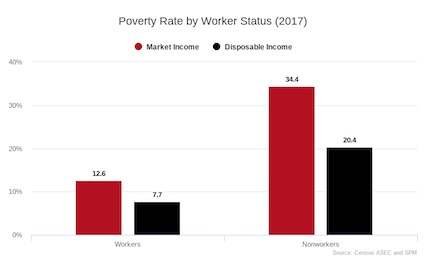
Nonworkers do not work and so they do not receive labor income. Most of them also do not own significant amounts of wealth and so they do not receive capital income. Naturally, this means that the poverty rate for nonworkers is quite high, especially when measured in terms of market income. The welfare state helps deliver some income to nonworkers, but the US welfare state is quite stingy, and so high poverty for nonworkers is present even when looking at disposable income.
As the below graph shows, the poverty rate of nonworkers is a little under 3 times the poverty rate of workers. Put differently, nonworkers make up around three-fourths of all poor people, despite making up just half of the population.
The above graph actually understates how significant nonwork is to poverty because “workers” includes anyone who worked 1 or more hour during the year and because many workers are only poor because they live with nonworkers, such as children or a disabled relative.
Poverty is measured on the family level, meaning that all of the income that a family receives is added together and then compared to a poverty line that is based on the number of people in the family. This is why not all nonworkers are poor based on market income: some live with workers who bring in income. This is also why not all full-time workers have incomes above the poverty line: some live with nonworkers and their incomes are not high enough to stretch across themselves and their nonworker family members.
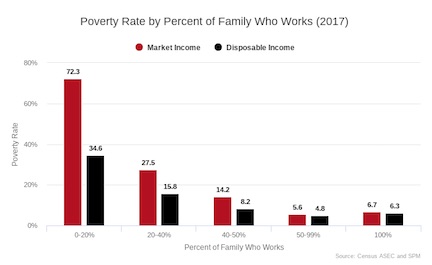
Given that poverty is measured on the family level, perhaps a better way of seeing how much nonwork drives poverty is to break down families by what percent of their members are workers. The following graph does this. Each category on the graph roughly represents around one-fifth of the US population. As you would expect, families where a low percentage of members work have higher poverty than families where a high percentage of members work.
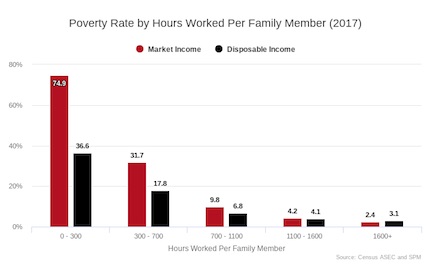
Another way to see this point is to focus on how many hours each family worked per family member. So, for instance, a family of four with one full-time worker, puts in 2,080 hours, which is equal to 520 hours per family member (2,080 divided by 4). The below graph shows you the poverty rate broken down by this measurement. As in the prior graph, each category is roughly one-fifth of the population.
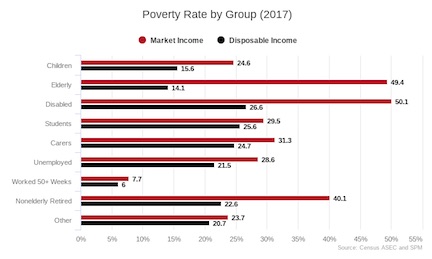
Finally, here is the poverty rate for the various groups I’ve identified already above. To that list of groups, I have also added “Worked 50+ Weeks,” which contains everyone who worked 50+ weeks. As you can see, the poverty rate of those who Worked 50+ Weeks was relatively low while the poverty rate of all the other categories was fairly high.
There are a dozen more ways to illustrate this point, but by now it should be clear: in an advanced economy like the US, poverty is something that plagues nonworkers.
The Welfare State Is The Solution
There are three basic insights that flow from this data:
1) poverty overwhelmingly afflicts nonworkers;
2) half of the population does not work; and
3) nearly everyone who is not currently working in our society cannot or should not work.
Once you accept all of these insights, the solution to poverty becomes very clear: a welfare state that provides income to nonworking people.
The US already has a modest welfare state that does this to some degree. Old-age benefits primarily from Social Security and SSI cut the elderly poverty rate from 49.4 percent to 14.1 percent. Transfer incomes paid to the disabled cut their poverty from 50.1 percent to 26.6 percent. If we want to get down to super-low poverty rates, we need to build on this success by, for instance, increasing minimum benefits for old-age and disability benefits, providing paid leave, free child care, and a child allowance to families with children, providing caregiver allowances to carers, increasing the generosity and duration of unemployment benefits, and increasing student benefits such as through a living stipend.
People who do not generally study poverty often erroneously believe that the answer to poverty is more jobs and higher wages. This is not surprising because this is the major poverty narrative of our society. But this strategy runs into a wall very quickly. The clear solution for ending poverty is welfare not jobs.
Source URL
|
 Print This Print This
|
If you appreciated this article, please consider making a donation to Axis of Logic.
We do not use commercial advertising or corporate funding. We depend solely upon you,
the reader, to continue providing quality news and opinion on world affairs. Donate here
|
|
World News

|